
Heikin Ashi Charts
Authored On: 09-Mar-16
Last Modified: 09-Mar-16
About. . .
The article details about Heikin Ashi charting technique. This Japanese technique helps traders to eliminate many false signals and helps in identifying clear trend as well as buy and sell signals.
Traditional candlestick charts pose set of difficulties to the chartists:
1> The red candles in an uptrend makes it difficult to conclude if the uptrend is over and down trend is starting
2> Similarly, green candles in a down trend makes it difficult to conclude if the down trend is now turning into uptrend
3> Spotting sideways movement becomes even more difficult and needs lot of chart observations
4> To support the candlestick readings, chartist often have to use more than one indicators and still may find results not so conclusive.
Heikin Ashi (HA) charts eliminate the "price noise" in the trend and continue to show consistent results. HA charts "normalize" the price action and continues to show a red candle in down trend, even if the candle actually is falling as green candle - if the price conditions are not warranting trend change. Similarly, in an uptrend, unless normalized price confirmations are observed about trend change, the actual red candle will be in fact displayed as green candle.
Also, HA charts have special type of candles that indicate "neutral", "neutral to bullish" and "neutral to bearish" trend features.
See the below chart for HDFC that shows above mentioned features of HA charts. The top among below two charts is normal candlestick chart and bottom among them is the HA version of the chart.

Bullish HA Candle
Following are five types of HA candles which make HA charts very intuitative to read for chartists:
Neutral to Bullish HA Candle
Neutral HA Candle
Bearish HA Candle
Neutral to Bearish HA Candle
Further to HA charting, chartists have developed what is known as "Smooth Heikin Ashi" candle charts (SHA). SHA charts further eliminate "price noise" that is still remaining in the HA charts. Please note that when you compute HA or SHA charts, the corresponding trend change signals may be given with a single or more period delay, due to added confirmation that these charts try to take in. Chartist should be aware of this fact.
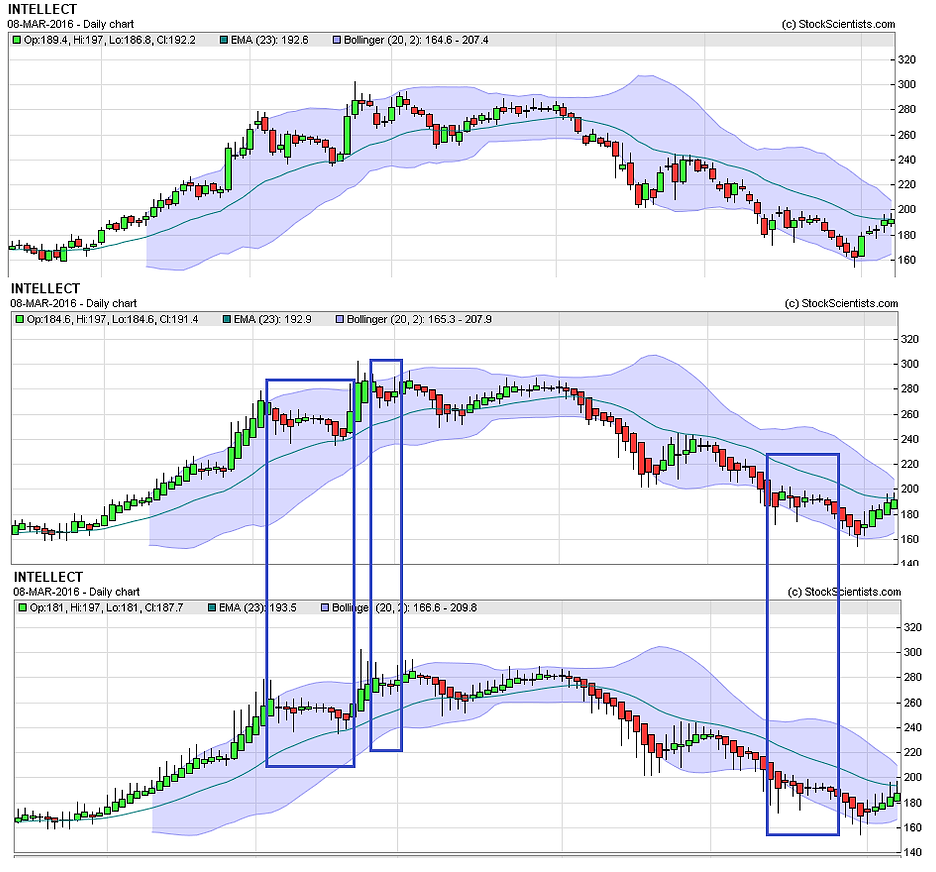
Below charts sequentially show the normal candlestick chart, HA chart corresponding to it and third one being SHA chart showing further smoothening.
Summary
Heikin Ashi technique is essential tool in the hands of chartists to eliminate price noise and see the trend in clear manner. When used with other indicators, Heikin Ashi and its smoothened version provide an accurate guidance for entry and exit points of trade.
PS - Please note that the exact calculations for HA candles are not given above, as most charting software and tools are likely to have HA built into their capabilities already.